The Rating Process Overview
This section provides a comprehensive overview of the structure of an impact analysis, guiding you through what to expect on your screen to facilitate a seamless and effective rating experience.
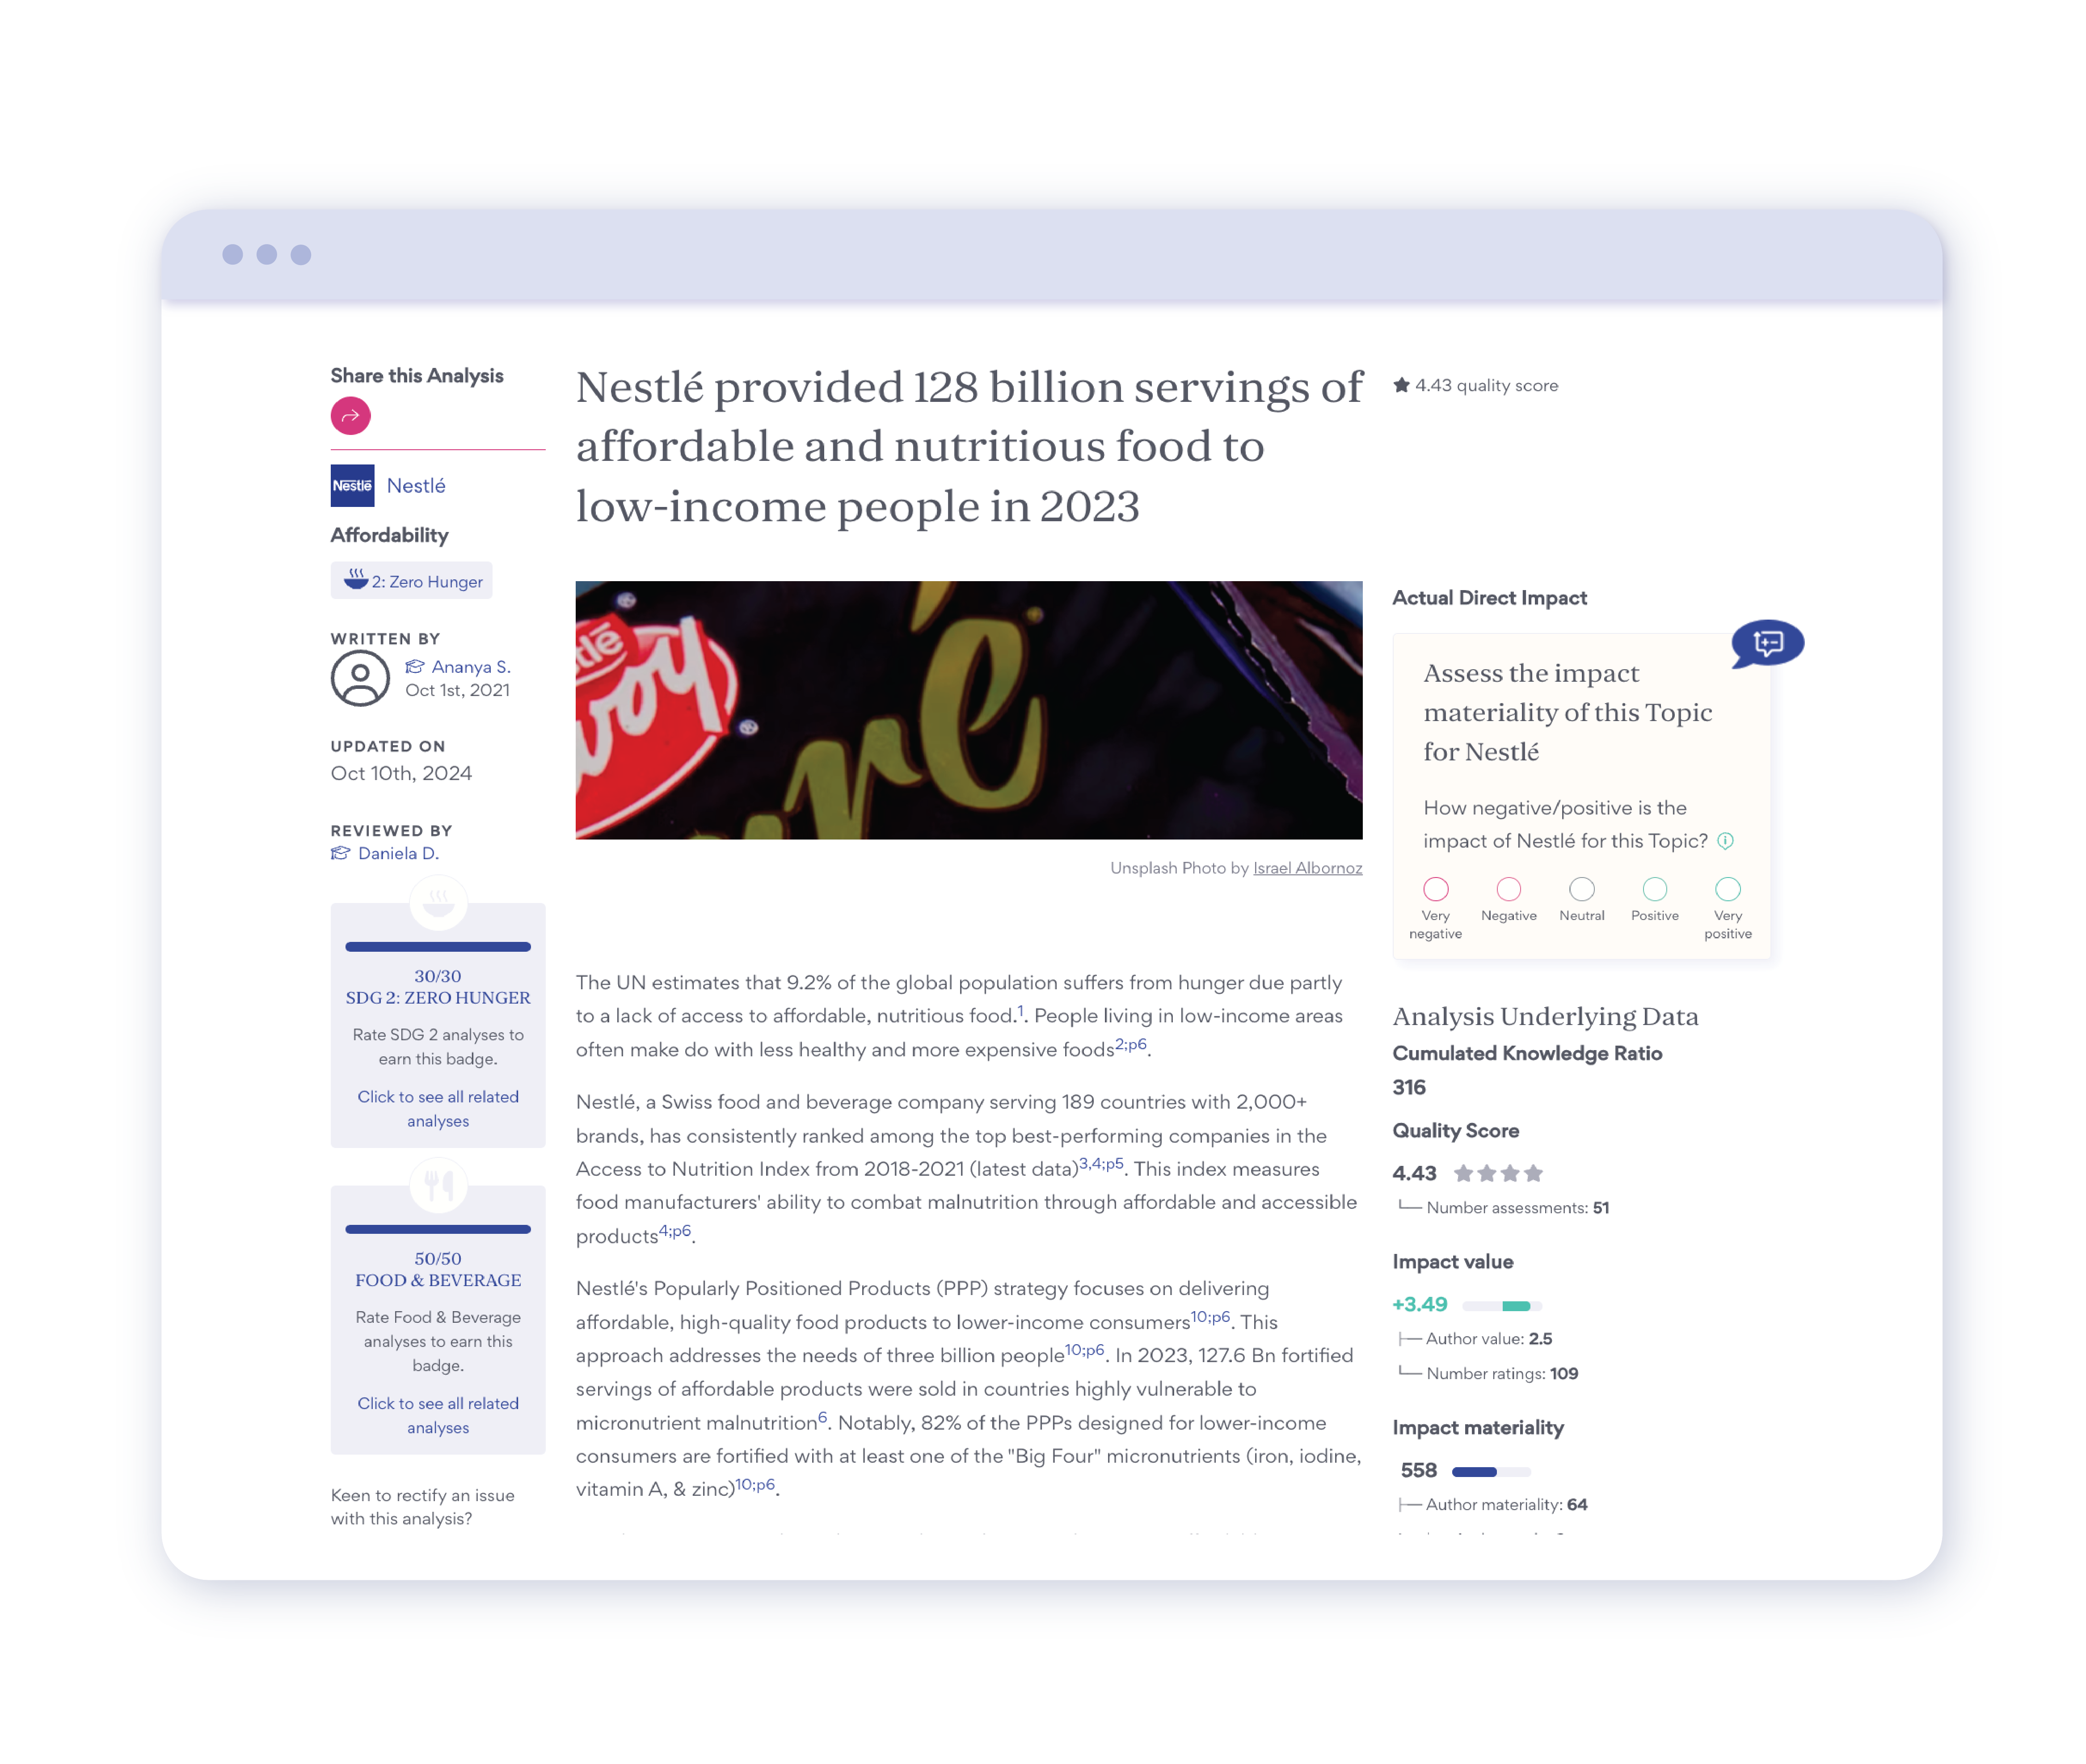
Every time you click on an analysis to read and rate, you’ll see that your screen will have three main areas with condensed information. The center contains the summary itself and the title, the left has all the pertinent information about the summary you’re reading, and on the right, you’ll find the rating box.
The Left Side
Here you’ll find key information about the analysis, including the company name, the specific impact topic (which the analysis is about), and the associated Sustainable Development Goal (SDG). This section also provides details about the author, publication date, and the internal expert reviewer who verified the summary's accuracy. Additionally, you’ll see the SDG badge and industry badge linked to this analysis; rating it helps you work toward achieving these badges. For more information on SDG & Industry Badges, please visit section 5. Finally, there's a button to report any inconsistencies you may find.
The Right Side
On the right side of the page, you will find the rating box, where you will assess the materiality of the topic for the company. We will explore how to navigate the rating box in detail in Section 3. After submitting your rating, you can scroll back up to continue your exercise by rating the same topic, industry, SDG, or company.
The Center
In the center of the page, you will find the main analysis text, which typically contains around 2,000 characters. This text is divided into three sections: the introduction, which provides context for the impact being described, either globally or in a relevant local area; the body, which contains both quantitative and qualitative information regarding the impact; and the conclusion, which summarizes the key points of the analysis. After reading the text, you will see data points that condense the main pieces of impact information for clarity. By clicking on each data point, you can view a graph that benchmarks the company’s impact against others in the Impaakt Universe, enabling a more informed assessment. Below the analysis, you will find the comment section, where you can engage with the analysis by sharing your thoughts about the topic. Additionally, you can view all hyperlinked sources referenced in the text and rate the overall quality of the analysis based on its objectiveness, relevance, and insightfulness.